How to Create Salesforce Reports: + A Better Way to Inspect Pipelines
Visibility is key for any sales leader to make informed decisions about forecasting and allocating resources to manage their team’s pipeline.
Salesforce reports play a key role in this by helping sales leaders keep tabs on performance and the overall health of their sales pipeline.
This article breaks down why Salesforce reports matter, explores different types of reports, and provides a step-by-step guide on how to create them in Salesforce.
We also highlight the biggest challenges and limitations Salesforce reports present for sales leaders and offer a better way to get increased visibility, inspect your pipeline easier, and get immediate answers to what's changing and why.
A Salesforce report is a tool in Salesforce that helps people organize and display their data in a way that's easy to understand. Through charts, graphs and other visualizations, it allows sales leaders to better understand the health of their sales pipeline so they can more accurately forecast future revenue and spot red flags for current deals at risk.
Why are Salesforce Reports important?
Salesforce reports are critical for sales leaders to clearly identify their team’s performance, progress, sales trends, and be proactive in closing and forecasting revenue. These reports help sales leaders understand their team's activities, sales pipelines, and customer interactions, ultimately improving their ability to manage and drive sales success.
6 Types of Salesforce Reports
1. Tabular Reports
Simple table format that is ideal for displaying a list of records, like opportunities, with desired details next to them.
2. Summary Reports
High-level overview that often groups information based on a specific field. These reports often include subtotals and grand totals for numerical data.
3. Matrix Reports
Group data both by rows and columns, providing a cross-tabulation view. They are suitable for analyzing data from different angles simultaneously.
4. Custom Reports
As the name suggests, these provide unique reporting requirements by selecting the report type and defining the fields, filters, and criteria they need.
5. Forecast reports
Predict and analyze sales revenue based on opportunities and their respective probability values like deal stage or forecast category depending on your team and organization.
6. Pipeline reports
Track the progress of deals and provide insights into sales stages, revenue projections, sales funnels, and total pipeline.
Step-by-Step Guide to Creating a Salesforce Report:
Before creating a Salesforce report, it's essential to do some groundwork to ensure that your report meets your specific needs. Here are the key steps to take:
1. Define Your Objectives:
Clearly outline the goals and objectives of the report. What insights or information are you trying to gain? Understanding your objectives will guide the report creation process.
2. Identify the Target Audience:
Determine who will be using the report and what information is most relevant to them. Tailoring the report to the needs of its audience ensures that it provides meaningful insights. For example, a manager may need a better understanding of specific fields vs. a CRO or an Account Executive.
3. Understand Your CRM Data:
Know which objects and fields contain the information you need for your report. Understand the relationships between different objects if you're working with joined or related reports.
4. Clean and Organize CRM Data:
Ensure that your Salesforce data is accurate and up-to-date. Cleaning and organizing data beforehand will prevent inaccuracies in your report and provide more reliable insights.
5. Create Custom Fields if Needed:
If the standard fields in Salesforce don't cover the specific information you require, consider creating custom fields. This step allows you to tailor your data to better suit your reporting needs.
6. Determine the Report Type:
Choose the appropriate report type based on the information you want to analyze. Salesforce offers various standard report types, and creating custom report types is an option if needed.
7. Plan Report Layout:
Sketch or outline how you want the report to look. Consider the arrangement of fields, groupings, and any charts or graphs you may want to include for visual representation.
By taking these preparatory steps, you'll be better equipped to create a Salesforce report that aligns with your objectives and provides valuable insights to support your decision-making process.
Now, let’s get into the nitty-gritty details:
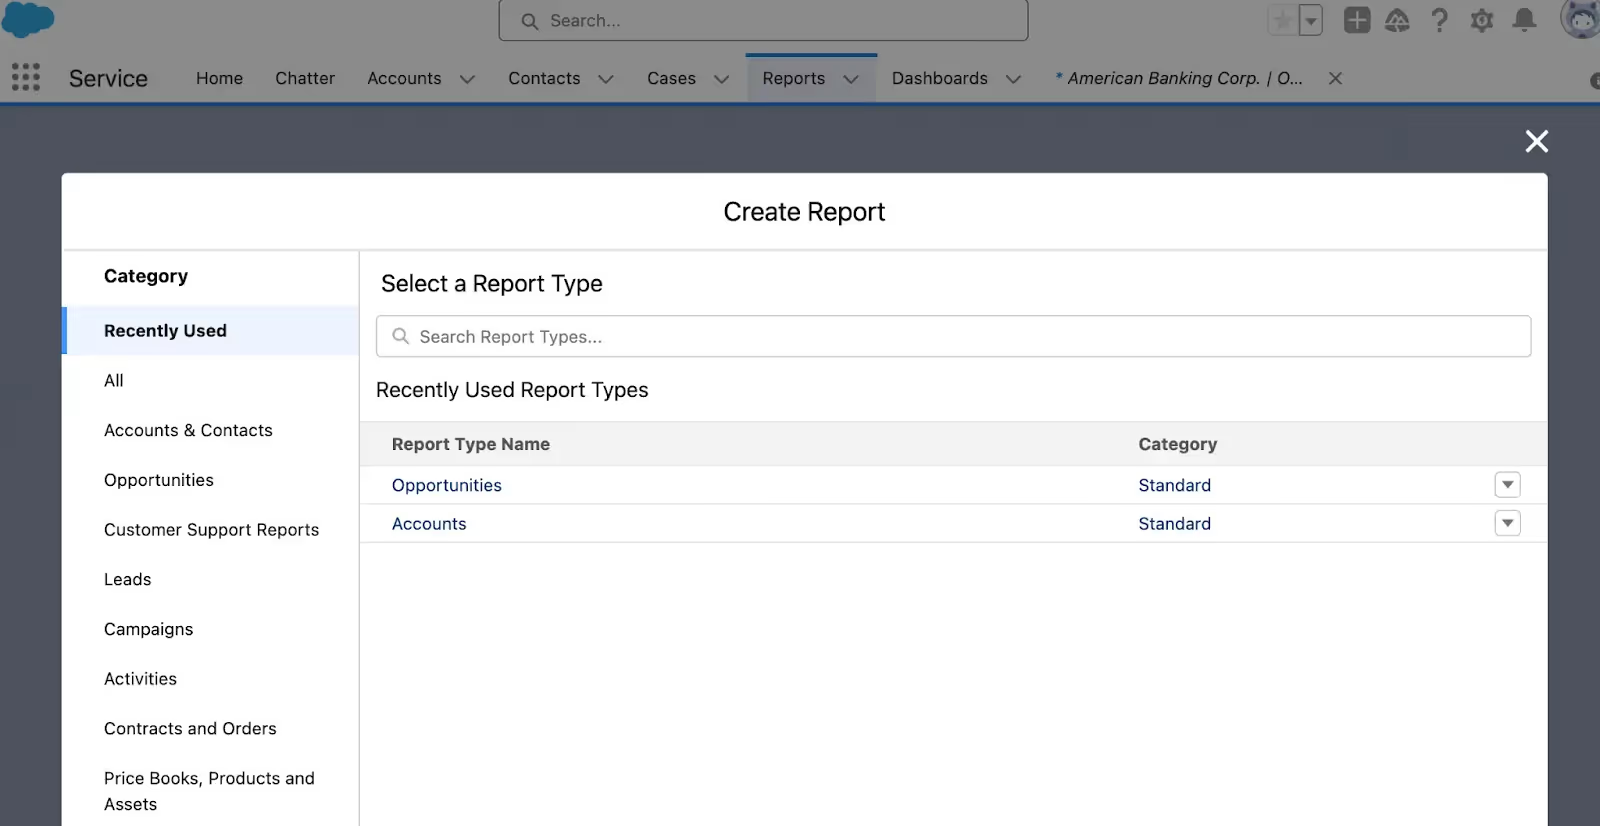
1. Create a New Report and select ‘report type’
2. Select the objects you want to include in your report
3. Select which fields to include or display on your report
4. Update the filters on your report
5. Save & Run your report where you’ll be asked to give it a name and description. Once you do so, you’re report will be active
Customizations and Additional Features in Salesforce reports
As we mentioned above, there are certain steps you need to take to ensure your reports are giving you the specific information that you need.
One of the aspects to consider is customizing your fields if the standard setup in Salesforce doesn’t give you the visualizations you need for your sales team.
Here’s how you customize your Salesforce reports:
Re-order fields
Simply click on the field you want to move, drag it to the desired position in the report columns, and drop it in place. After rearranging fields, you may need to adjust the column widths to ensure that the report layout looks clean and organized. Hover between the column headers until you see the double-headed arrow, then click and drag to resize.
Add charts for better visualization
In the Report Builder, look for the "Chart" tab or section. Salesforce offers various chart types, such as bar charts, pie charts, line charts, and more. Select the chart type that best suits your visualization needs and customize the chart by selecting the fields for the X-axis, Y-axis, and any additional data series or groupings. Adjust chart options like colors, labels, and legends based on your preferences. You can further customize the report layout by adjusting the size and position of the chart within the report.
Schedule Your Reports
You’re also able to schedule a report to go out every day, week, month by clicking on Subscribe in the top right drop down menu.
4 Limitations of Using Salesforce Reports
Salesforce reports allow grouping, but reports are not in-line editable and records open in a new tab. This makes updating Salesforce from within the report difficult.
Salesforce is often not up-to-date nor accurate so relying on Salesforce reports can lead to misinformed decisions
Salesforce reports are not easy to navigate. If there are changes made, it’s hard for a sales leader to determine which deals changed and why.
Users may be constrained by the available report types, and creating custom report types can be challenging for non-technical users.
While Salesforce is an extremely powerful CRM and critical for any major sales organization, the limitations it forces on everyone from Account Executives to Sales Managers to CROs, can leave you with flawed data and a lack of visibility that creates inaccurate sales forecasts, lost revenue, and a poor customer experience.
However, there is a great alternative that gives reps and their sales leaders a better way to update Salesforce, manage pipeline, inspect deals and forecast accurately. Here are a few of the reasons why Scratchpad is so affective:
Deal Spotlights
Conditional highlighting gives leaders the ability to understand granular details of every opportunity in your pipeline. Quickly see what deals haven’t progressed stages, which need fast prioritization, which late stage opportunities haven’t had updates in weeks, or which deals committed have expired close dates.
As you’ll see with all of Scratchpad’s features we mention, the opportunities are in-line editable, or you can leave comments on them so managers and sales leaders can make edits or tag their reps in opportunities that are at-risk or simply need attention.
Change Highlights
Visualize what changed with your team’s deals. Understand why a close date pushed, which deals increased or decreased in value, and what opportunities changed stages. This prevents sales leaders from being blindsided and instead gives them the ability to be proactive in coaching reps and helping them progress deals through the pipeline.
Advanced Grid Views and Kanban Views
Easily view your entire pipeline in one place. Sort by rep or team and track deal progression in one place.
Group your pipeline into manageable sections and do calculations, make updates in-line, or open a record to see details, all without opening a new tab.
This is the easiest way for sales managers to track the progress of specific deals that they otherwise wouldn’t be able to see in most Salesforce reports.
Customizable Grid View:
Kanban View:
Command
See all of the details in your opportunities directly right from your Salesforce report in fewer clicks and without opening new tabs. Simply hit CMD+J on a mac or CTRL+J on windows from anywhere on the web like your Google Calendar, a spreadsheet, even your prospect’s website.
Once you hit the shortcut, you can pull up, edit, or add contacts, opportunities, accounts, or whatever you need to inspect your pipeline with ease and speed.
Command of Reports
Sometimes, working out of a Salesforce Report is your only option. But even in this case, Scratchpad can still help.
Command of Reports makes Salesforce Reports instantly editable and collaborative.
Get faster visibility into every piece of deal information so you can have more effective 1:1’s, forecasting calls, and coaching opportunities with your reps.