Sales Forecasting in Excel: Step-by-Step Guide + A Better Way
Sales forecasting in Excel spreadsheets isn’t easy.
Juggling tabs and grappling with complex models can often feel overwhelming.
But for many sales leaders, managers, and reps, it’s still the most accessible way to forecast.
So, to make things easier for sales teams everywhere, we’ll break down the Excel forecasting process into some easy-to-follow steps. This should demystify things and clear up any doubts you may have.
But we’re not stopping there.
We're also going to show you a better, more delightful way to create and manage your sales forecast without ever needing a spreadsheet, CRM data exports, and Salesforce reports.
Imagine a beautifully simple way to forecast connected to Salesforce....More on this later.
Step-by-Step Guide to Sales Forecasting in Excel (3 Common Models)
Before we dive into the nitty-gritty of three popular Excel forecasting models, here’s a bird's-eye view of the general steps involved – irrespective of the model you choose:
Gather and Prepare Your CRM Data: Begin by collecting historical sales data, ensuring it's accurate, clean, and organized.
Choose the Right Sales Forecasting Model: Select a model that aligns with your business patterns and data trends. Whether it's linear regession for steady trends, moving averages for short-term fluctuations, or exponential smoothing for more complex patterns, choosing a suitable model will sharpen your forecast's accuracy.
Set Up Your Excel Sheet: Structure your Excel workbook with designated data input, calculations, and output areas.
Input Your Data and Formulas: Populate the Excel sheet with your historical data and input the relevant formulas corresponding to your chosen forecasting model.
Analyze the Sales Forecasting Results: Examine the output to gauge the forecast's reliability. Look for patterns, anomalies, and the overall fit with historical trends.
Visualize the Data: Use Excel's charting tools to create visual representations of your data and forecasts. Graphs and charts make the data more digestible by highlighting trends and outliers at a glance.
Note: If you’d like to first compare each of the three models to determine their suitability for your needs, check this section out first.
And if you want to skip all these confusing steps and discover a better way of forecasting, click here.
Now, let’s delve into the details of each model:
1. Linear Regression
Linear regression is a statistical method that identifies the relationship between an independent variable (dates) and a dependent variable (sales) by fitting a straight line through the data.
This method is suitable for forecasting sales when there is a clear linear relationship between sales and time.
Here’s how to use linear regression for forecasting sales in Excel:
Step 1: Gather and Organize the Data
Start by collecting your historical CRM data. In Excel, create two columns: one for the sales period and one for the sales figures.
Make sure to arrange the data in chronological order.
Why?
Without arranging the data in chronological order, the analysis could produce misleading results, as the model assumes that each data point follows the previous one in time.
Step 2: Identify Your Forecasting Cell
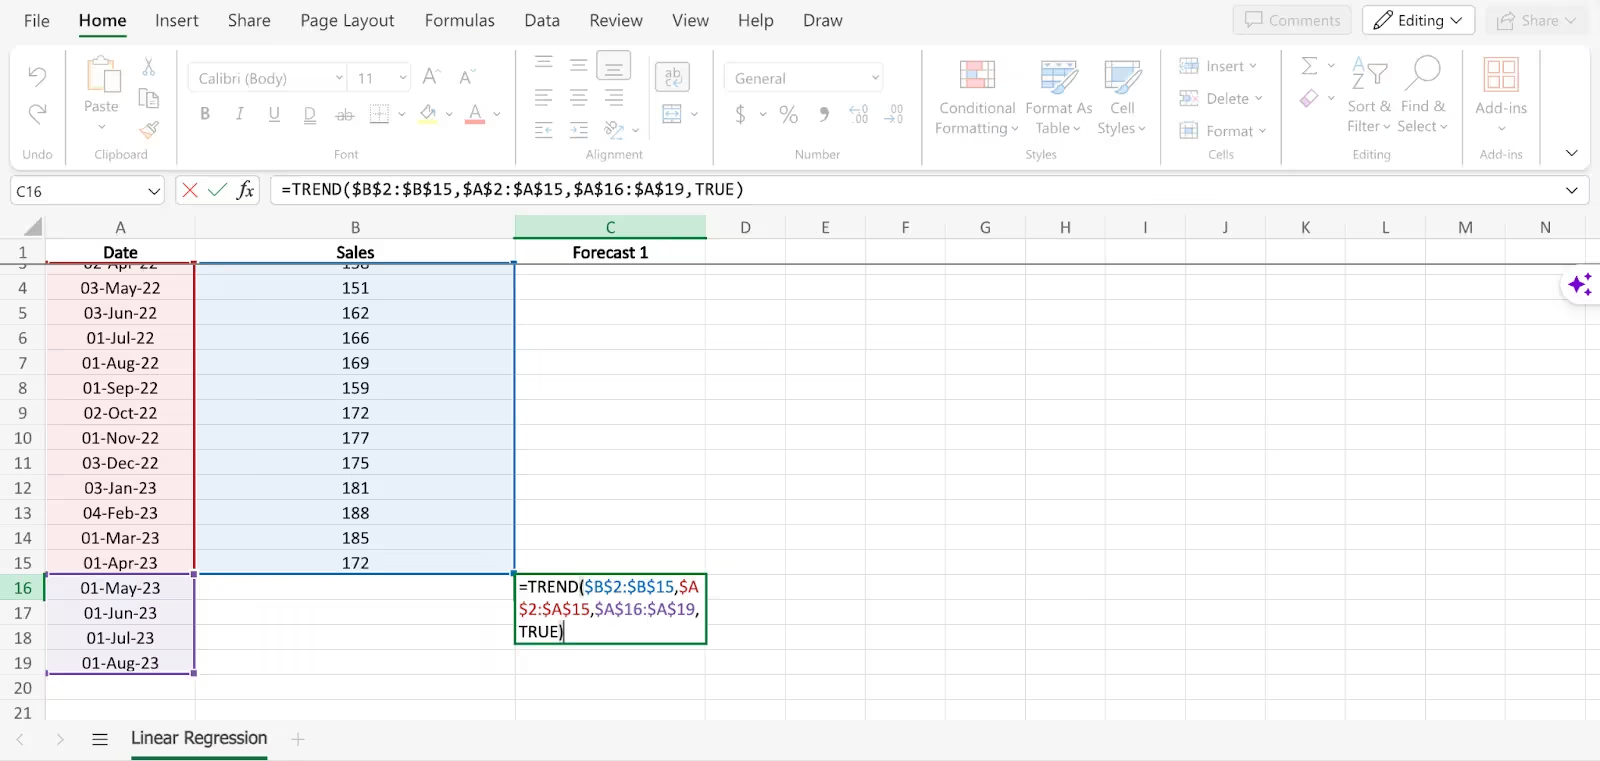
Designate a new column to show the forecasted values. Each cell in this column will have a forecast for the corresponding date in the future.
The selected cells in the screengrab below are where the forecast values for the upcoming dates will be added.
Step 3: Apply Linear Regression
Assuming your time and sales data follow a linear trend, you can directly use either the TREND or FORECAST function to predict future value. We’ve listed down steps using the TREND function.
Enter the following formula in the cell where you want to forecast (cells for the upcoming month): {=TREND(known_y's, known_x's, [new_x's])}
Replace the placeholders with your actual data:
known_y's: The range of cells containing your historical sales data (the ‘Sales’ column).
known_x's: The range of cells containing the corresponding time/date data (the "Date" column).
[new_x's]: The range of cells containing the dates you want to forecast sales values.
Remember to press F4 while entering the cell ranges in the formula to lock them.
Press Enter. The TREND function will calculate the slope and intercept of the best-fit line and display the results in the cell. Keep applying the formula to appropriate cells for the next months to predict future sales revenue.
Step 5: Visualize Your Forecast
Creating a visual representation is crucial for interpreting the data and the forecast's accuracy.
Here’s how to do it in a few simple steps:
Create a Line Chart for the original and forecasted data:
Select your date, historical sales, and forecasted sales columns.
Go to the 'Insert' tab in Excel.
Choose the 'Line' chart from the Charts group and pick a type.
This line chart will map your historical and predicted sales figures against time, allowing you to see sales patterns over time.
Step 6: Evaluate and Adjust
Finally, assess the accuracy of your forecast:
Analyze the Results: Look at how well the predicted sales figures match up with the existing data.
Make Adjustments: If necessary, refine your model by adjusting the date range to improve the forecast's accuracy.
2. Moving Average
The moving average method smooths out short-term fluctuations in sales data and highlights longer-term trends or cycles in the data by averaging recent sales data points.
Follow these steps to forecast using moving averages:
Step 1: Input Historical Data
Open Excel and input your historical sales data in two columns.
Label the first column for periods (e.g., "Months") and the second for past sales data (e.g., "Revenue").
Ensure the time periods are in chronological order for clarity and accuracy.
Step 2: Identify Your Forecasting Cell
Decide where you want your moving average forecast to be displayed.
Typically, this will be in the next column adjacent to your last historical sale/revenue number.
Step 3: Choose the Moving Average Period
Select the number of periods for your moving average based on your data's seasonality.
Common choices are 3 months for short-term trends, 5 for medium-term, and 12 for annual trends, depending on the seasonality and variability of your data.
Step 4: Calculate the Moving Averages
In a new column next to your data, type =AVERAGE(range) to calculate the moving average.
Replace ‘range’ with the range of cells that correspond to the number of periods you chose in Step 3. For example, if calculating a 3-month moving average, select the first three months of sales data.
Press Enter. Excel will calculate the moving average for the first period.
Step 5: Forecast Future Values
You simply need to extend the moving averages series to forecast future values. To do that, drag the moving average formula down to the next row(s) as required.
Step 6: Visualize the Data and Moving Averages
Highlight the columns of time periods, original data, and moving averages.
Go to the “Insert” tab, select “Charts,” and choose “Line Chart” or “Scatter Plot” to create a chart of your data.
Format the chart as needed to differentiate between the original data and the moving averages clearly.
Step 6: Evaluate and Adjust
Use the chart to assess the accuracy of your moving averages model visually. Look at how well the moving averages align with the original sales figures and identify patterns or trends.
Adjust the number of periods in your moving average to improve accuracy.
Step 7: Document Your Findings
Keep a record of your forecasts and the actual outcomes to track your model's performance over time.
Use this data to refine your forecasting process and enhance the accuracy of future projections.
3. Exponential Smoothing
Exponential Smoothing applies weighted averages on past sales data, emphasizing more recent data points over older records, to predict future sales trends.
This helps ‘smoothen’ the noise and irregularities in the data, giving a clearer picture of the overall trend and allowing for more accurate forecasts.
The exponential smoothing method accounts for these three critical components in your time series data:
Error: Random fluctuations or discrepancies in your sales data after accounting for the trend and seasonality components.
Trend: Long-term trends in your sales data that indicate growth, decline, or stability.
Seasonality: Recurring pattern of sales fluctuations observed over a fixed period.
Here are the steps to forecast sales using the Exponential Smoothing forecasting method in Excel:
Step 1: Prepare Your Data
Place your historical sales data in two columns: dates in the first and sales figures in the second.
To ensure accurate predictions, it is crucial to have your time series in chronological order and with consistent intervals in between.
Select the cell where you want the forecasted value to appear. This cell is typically at the end of your historical data, in the row immediately following the last entry of your existing monthly sales data. Or it could be in a new column next to future dates for sales prediction.
Step 3: Apply the FORECAST.ETS Function
Enter the formula {=FORECAST.ETS(target_date, values, timeline, [seasonality], [data_completion], [aggregation])} into your forecasting cell. ETS stands for Exponential Triple Smoothing, which refers to the method's ability to smooth out noise in the data.
Fill out the following placeholders with your actual data:
target_date: The date for which you want to forecast the sales value.
values: The range of cells containing your historical sales data (column 2).
timeline: The range of cells containing your corresponding time/date data (column 1)
The optional seasonality parameter indicates whether the data shows a seasonal pattern (1 for seasonal, 0 for non-seasonal).
The optional data_completion parameter specifies whether the data is complete (0 for complete, 1 for missing values).
The optional aggregation parameter indicates the aggregation level (0 for monthly, 1 for quarterly)
Once you've entered the formula, press Enter. Excel will calculate and display the forecasted value in the selected cell.
Step 4: Visualize the Forecast
Highlight the date (column 1), historical sales data (column 2), and the forecasted value (column 3).
Insert a line chart to visualize the trend and the extended forecast.
Optionally, add trendlines to identify the overall trend in the data.
Step 5: Extend the Forecast as Needed
Add additional future time periods in the timeline column (column 1).
Use the FORECAST.ETS function for each new time period, replacing the target_date placeholder with the corresponding future date.
Step 6: Evaluate and Adjust
Review the forecasted results, compare them with known data, and adjust your model parameters as necessary to improve accuracy.
To enhance the reliability of your predictions, consider calculating a confidence interval.
This statistical range estimates where the actual sales figures are likely to fall, providing a measure of the forecast's precision.
Want to start forecasting right away without going through these complex steps?
Simply use this pre-built Excel sales forecast template from Onplan. Simply download the Google Sheet in Excel format (.xlsx) and follow the instructions.
While Excel remains a popular tool for demand and sales analytics and forecasting, it's not without limitations
8 Limitations of Sales Forecasting in Excel
Let’s uncover how sales forecasting in Excel or Google Sheets isn’t optimal:
1. Manual Data Entry and Management
Populating an Excel spreadsheet typically requires manually pulling data from a CRM like Salesforce.
This is time-consuming and susceptible to errors which can lead to inaccuracies that skew forecasting results.
2. Limited Data Integrations with CRMs
Using Excel alongside your chosen CRM isn’t easy.
For example, it can connect with the Salesforce database using an Open Database (ODBC) connector. However, the ODBC connection requires you to install additional drivers and tools and go through a complicated setup process.
Plus, it can't handle large Salesforce objects and data very well, which can limit the amount of data you can exchange.
Another issue is that the real-time integration between the two tools is slow, so the data can quickly become outdated. This can lead to forecasts that don't accurately reflect the current market dynamics.
That said, you can effectively integrate Excel with Salesforce using powerful add-on tools that support real-time data exchange (more on this later).
3. Limited Forecasting Models to Work With
Excel supports only a few forecasting models, limiting your analysis's depth and flexibility and potentially oversimplifying complex sales patterns.
4. Lack of Automation
You can only achieve basic forecasting automation in Excel when using add-ins like Analysis ToolPak or the forecast sheet feature.
The limited automation features results in many repetitive tasks being performed manually, reducing efficiency and increasing the likelihood of error in your sales forecasting.
5. Contextual Issues Over Data
Spreadsheets provide a numerical representation of your sales data, but they often fail to capture the contextual information surrounding deals.
For instance, a spreadsheet may show a decline in forecast Commit, but it won't uncover the specific deals or factors driving this drop.
Spreadsheets also fail to provide insight into how Commits change relative to Best Case over time and the reasons behind fluctuations.
Why?
It's not possible to access the deal details for each rep that makes up the forecast by browsing a spreadsheet
Without contextual deal information, managers and leaders may miss root causes of forecast changes and fail to take timely corrective action.
6. Limited Collaboration and Visibility into Forecasts
Spreadsheets are inherently siloed tools, making it difficult for sales teams to collaborate effectively on forecasts and share insights across different departments.
This lack of collaboration can lead to inaccurate forecasts, misaligned goals, and missed opportunities.
Let’s elaborate on that:
7. Unseen Costs of Manual Forecasting with Excel
Relying on Excel for sales forecasting has significant unseen costs that hurt profitability:
A. Opportunity Cost of Manual Processes
Sales forecasting using Excel often requires a substantial amount of manual effort from sales reps, analysts, and operations personnel.
This time spent on data entry, formula manipulation, and error correction could be better utilized for more value-added activities.
B. Cost of Human Error
The manual nature of spreadsheet-based forecasting also makes it susceptible to human error, which can have far-reaching consequences for sales performance.
Mistakes in data entry, formula errors, and inconsistencies in calculations can lead to inaccurate forecasts that mislead decision-making.
8. Poor Scalability
Excel's capabilities can be quickly outpaced as your business grows, leading to performance issues and a forecasting process that can't keep up with the expanding scale of operations.
Not designed for the way reps work. This leads to reps storing data outside of the CRM, which makes it difficult for sales leaders to get accurate forecasts.
Not user-friendly for a sales manager or leader. This forces them to leverage spreadsheets instead, which are prone to errors and lack context.
So, is there a solution to these forecasting problems?
Scratchpad is a new experience that makes managing pipeline, inspecting deals, coaching, and forecasting fast, simple, and delightful.
The end goal?
To help sales teams achieve their highest levels of performance.
Scratchpad gives sales leaders data they can trust and better visibility into that data that helps with:
Manage demand fulfillment
Uncover trends in customer acquisition and churn
Predict future development or inventory needs
Achieve optimal resource allocation and streamline inventory management
Spot potential supply chain issues.
Key Features
Here are some key Scratchpad features that make it a must-have tool:
1. Visualize Your Salesforce Data in Real Time
Say goodbye to stale data in spreadsheets with Advanced Grid Views and Change Highlights.
Scratchpad syncs seamlessly with Salesforce, so instead of trying to inspect pipeline in a spreadsheet, you get the same experience, but with up-to-date information in Advanced Grid Views.
Within Grid Views, you’re able to utilize Change Highlights that brings your Salesforce pipeline to life and helps you visualize what changed with your team’s deals. Now you know exactly why a close date pushed, which deals increased or decreased in value, and what opportunities changed stages.
2. Dynamic Roll-Ups to Track Deals at Every Level
Configure weekly roll-ups to give yourself a clear view of your team’s deals. Analyze sales regions, teams, and individual performance in more detail over time. View which deals make up your team’s forecasts, investigate changes in numbers, or make overrides.
In other words, you can switch from a bird's-eye view to granular details for easy inspection and a comprehensive picture of your opportunities in just a few clicks.
And that's not all.
You can view the roll-ups for your total pipeline or across individual categories like commit and best case.
This level of visibility allows you to spot bottlenecks and opportunities in your pipeline with ease. It also lets you monitor your team’s performance at every level and provide targeted coaching to your reps.
Scratchpad’s dynamic roll-ups provide a significant step up from Excel spreadsheets!
How?
You sidestep the tedious task of manually exporting data from Salesforce for roll-ups, saving precious time.
Plus, you avoid the pitfalls of relying on potentially outdated/bad data, as Scratchpad ensures your team's opportunity data is always current and accurate — ensuring no more guesswork, delays, or data mishaps.
3. See Daily Snapshots of Historical Pipeline Changes with Trends Analytics
Scratchpad takes automated snapshots of your sales pipeline, giving sales managers and leaders a day-by-day overview of the pipeline’s progress.
By reviewing your daily snapshots regularly, you can identify trends and patterns in your revenue forecasts and make informed decisions about your sales strategy.
4. Understand What Changed and Why with Waterfall Analytics
Waterfall Analytics offers a clear, actionable view of your sales forecast.
By analyzing the waterfall chart, you can track changes in the forecasted amount and what triggered them.
You can do this for different time periods and across forecast categories — be it your total pipeline or individual categories like commit, best case, etc. You can then drill down further to see the deal makeup in detail and get to the root cause behind the change.
This contextual analysis is simply impossible with Excel spreadsheets.
5. Track Revenue Forecasts Based on Your Sales Stages (Stage Progression)
Your sales company may have a pre-determined and unique set of sales stages through which the deals progress. And at times, you may want to track pipeline changes based on these stages rather than defined Salesforce forecast categories.
With the Stage Progression view, you can track your pipeline across different stages of your sales funnel, leveraging all of its powerful analytics and roll-up features.
6. Update Your CRM From Anywhere
Have your sales data outside of Salesforce?
No problem!
Scratchpad Command seamlessly integrates Salesforce into users' web browsing experience, eliminating the need for multiple tools.
You can effortlessly search, update, create, and view any records within Salesforce from anywhere - even from an Excel spreadsheet.
The best part?
Setting up Scratchpad is a breeze, and you can get started with just a few clicks.
Here’s how to go about it:
Ensure your Salesforce instance is updated with the necessary Roles/Forecast Hierarchy.
Add the 'Allow Forecasting' permission at the User level in Salesforce.
Ensure the 'View Roles and Role Hierarchy' permission is enabled at the Profile level in Salesforce.
From your Scratchpad Homepage, select 'Forecast,' then navigate to 'Forecast Settings.'
Want to customize a forecast? Click on the forecast you wish to edit. Here, you can adjust general settings such as Name, Forecast Period, and Categories. This section also allows you to configure Targets.
Use the '+New Forecast' option in Scratchpad Studio to set up multiple forecasts according to your business needs.
Have further questions about sales forecasting in Excel?
Let’s tackle them.
2 FAQs About Sales Forecasting in Excel
1. What Are the Differences Between Excel Forecasting Models?
We delved into the intricacies of three common Excel sales forecasting methods – linear regression, moving average, and exponential smoothing.
But how are they different from each other? And which one should you opt for?
Let’s look at the pros, cons, and ideal use scenarios for these models to help you make an informed choice.
A. Linear Regression Model
Pros
Simple and easy to understand
Excellent for identifying and extrapolating long-term trends in data
Cons
May not accurately forecast for markets with non-linear patterns as it assumes a constant rate of change
Extreme values can significantly skew the forecast.
Ideal For
Long-term forecasting
Sales environments with a clear upward or downward trend where past patterns are strong indicators of future value
B. Moving Average Model
Pros
Easy to understand and implement
Effective in smoothing out irregular data patterns
Cons
Can’t predict accurately for quickly changing markets
The choice of the period length can significantly impact results as it doesn't account for data outside that time period
Ideal For
Short-term forecasting where the recent past is a good predictor for the near future. For e.g., predicting inventory needs based on recent sales patterns.
Assessing the impact of short-term promotional campaigns
C. Exponential Smoothing Model
Pros
Gives more weight to recent observations, making it more responsive to changes.
Can be adjusted for trend and seasonality.
Cons
Complex to set up and interpret.
Requires choosing parameters like smoothing factors, which can be subjective.
Ideal For
Forecasting seasonal sales patterns, such as holiday sales or back-to-school spikes
Adapting forecasts to changing market conditions
2. How Often Should You Adjust Your Sales Forecast Based on Market Conditions?
A good rule of thumb is to review your forecast at least once a month and adjust it as needed based on changes in market conditions.
That said, your review and adjustment frequency should match factors like:
The nature of your industry: For industries that change quickly, like tech or fashion, forecasts may need to be updated more often than for relatively stable industries like food or utilities.
The volatility of the market. Consider opting for:
Quarterly reviews for relatively stable markets
Monthly or even weekly reviews for dynamic markets
Real-time or daily adjustments for highly volatile markets
Availability of new data: If you get access to new data frequently, you'll need to update your forecast more often as well.
Boost Your Forecast Accuracy with Scratchpad
You can certainly perform basic sales analytics and forecasting in Excel as many sales reps, leaders, and corporate finance teams currently do.
But that doesn’t mean that they should.
Forecasting in Excel has several limitations that could hamper the accuracy of your estimates, affecting your future sales performance. That’s where a more advanced and user-friendly tool like Scratchpad comes in.
It gives you absolute visibility of your pipeline, empowering you to forecast with pinpoint accuracy.